
Global sales from natural rubber exports by country in 2015 amounted to US$14 billion.
That amount represents an average -69.7% drop in value since 2011 when natural rubber shipments were valued at $45.9 billion. Year over year, rubber shipments depreciated by -17.8% from 2014 to 2015.
Among continents, Asian countries accounted for about $12 billion or 86% of international natural rubber sales. African exporters supplied 7.3% followed by European businesses at 4.7%.
Accounting for a much smaller percentage of exported natural rubber was Latin America (excluding Mexico) and the Caribbean at 1.1% while North America was the laggard at 0.9% of global rubber shipments.
The 4-digit Harmonized Tariff System code prefix for natural rubber is 4001.
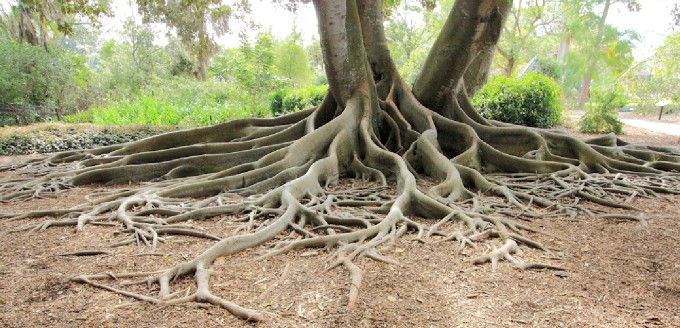
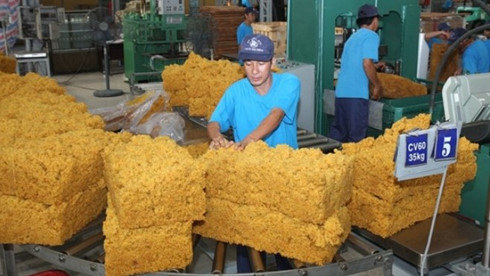
Rubber tree roots
Natural Rubber Exports by Countries
Below are the 15 countries that exported the highest dollar value worth of natural rubber during 2015:
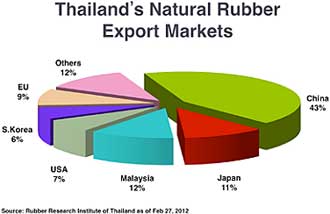
- Thailand: US$5 billion (35.8% of total natural rubber exports)
- Indonesia: $4.4 billion (31.5%)
- Vietnam: $1 billion (7.5%)
- Malaysia: $1 billion (7.4%)
- Côte d’Ivoire: $660.3 million (4.7%)
- Germany: $242.3 million (1.7%)
- Guatemala: $138.1 million (1%)
- Belgium: $123 million (0.9%)
- Myanmar (Burma): $117.6 million (0.8%)
- Singapore: $113.4 million (0.8%)
- United States: $111.6 million (0.8%)
- Liberia: $107.4 million (0.8%)
- Luxembourg: $88.6 million (0.6%)
- Cameroon: $76.7 million (0.6%)
- Laos: $73 million (0.5%)
Fourteen of the top 15 natural rubber exporters posted declines from 2011 to 2015, led by Singapore (down -77.8%), Luxembourg (down -77.4%), Malaysia (down -76.2%) and Liberia (down -70.1%).
Only one country bucked the negative growth trend. Rubber export sales from Laos rose 92.6% in value from 2011 to 2015.
The listed 15 countries accounted for 95.5% of all natural rubber exports during 2015.
Natural Rubber Exports by Advantages
The following countries posted the highest positive net exports for natural rubber during 2015. Investopedia defines net exports as the value of a country’s total exports minus the value of its total imports. Thus, the statistics below present the surplus between the value of each country’s natural rubber exports and its import purchases for that same commodity.
- Thailand: US$5 billion (net export surplus down -62.2% since 2011)
- Indonesia: $4.3 billion (down -62.8%)
- Vietnam: $1 billion (down -61.4%)
- Côte d’Ivoire: $660 million (down -40.9%)
- Guatemala: $136.3 million (down -64.5%)
- Myanmar (Burma): $117.4 million (down -47.3%)
- Liberia: $107.4 million (down -70.1%)
- Cameroon: $76.6 million (down -41.6%)
- Nigeria: $61.3 million (down -99.0%)
- Laos: $61.3 million (up 114.7%)
- Philippines: $45.4 million (down -42.9%)
- Cambodia: $43.2 million (down -77.3%)
- Ghana: $39.2 million (down -71.6%)
- Gabon: $28.9 million (down -67.8%)
- Guinea: $23.2 million (up 8.6%)
Thailand has the highest surplus in the international trade of natural rubber. In turn, this positive cashflow confirms Thailand’s strong competitive advantage for this specific resource category.
Natural Rubber Exports by Opportunities
The following countries posted the highest negative net exports for natural rubber during 2015. Investopedia defines net exports as the value of a country’s total exports minus the value of its total imports. Thus, the statistics below present the deficit between the value of each country’s natural rubber import purchases and its exports for that same commodity.
- China: US-$3.9 billion (net export deficit down -58.1% since 2011)
- United States: -$1.5 billion (down -67.5%)
- Japan: -$1.1 billion (down -72.2%)
- India: -$688.8 million (up 30.8%)
- South Korea: -$610.4 million (down -68.3%)
- Germany: -$346.8 million (down -75.1%)
- Brazil: -$334.6 million (down -68.1%)
- Spain: -$273 million (down -67.6%)
- Malaysia: -$272.6 million (down -113.3%)
- Turkey: -$254.9 million (down -64.7%)
- Canada: -$230.9 million (down -67.1%)
- France: -$208.1 million (down -74.3%)
- Italy: -$199.1 million (down -67.3%)
- Taiwan: -$163.5 million (down -67.8%)
- Poland: -$162 million (down -71.4%)
The People’s Republic of China ran up the highest deficit in the international trade of natural rubber. In turn, this negative cashflow highlights China’s strong competitive disadvantage for this specific resource category but also signals opportunities for natural rubber-supplying countries that help satisfy the powerful demand of Chinese manufacturers.
Source: worldstopexports.com